
WorkshopPast event
Charts That Talk : Data Visualisation and Storytelling
Turning Raw Data into Compelling Stories
Dec 2025
18
- Thursday
- 9am to 11.30am
- The Cube, Block A, FSKTM
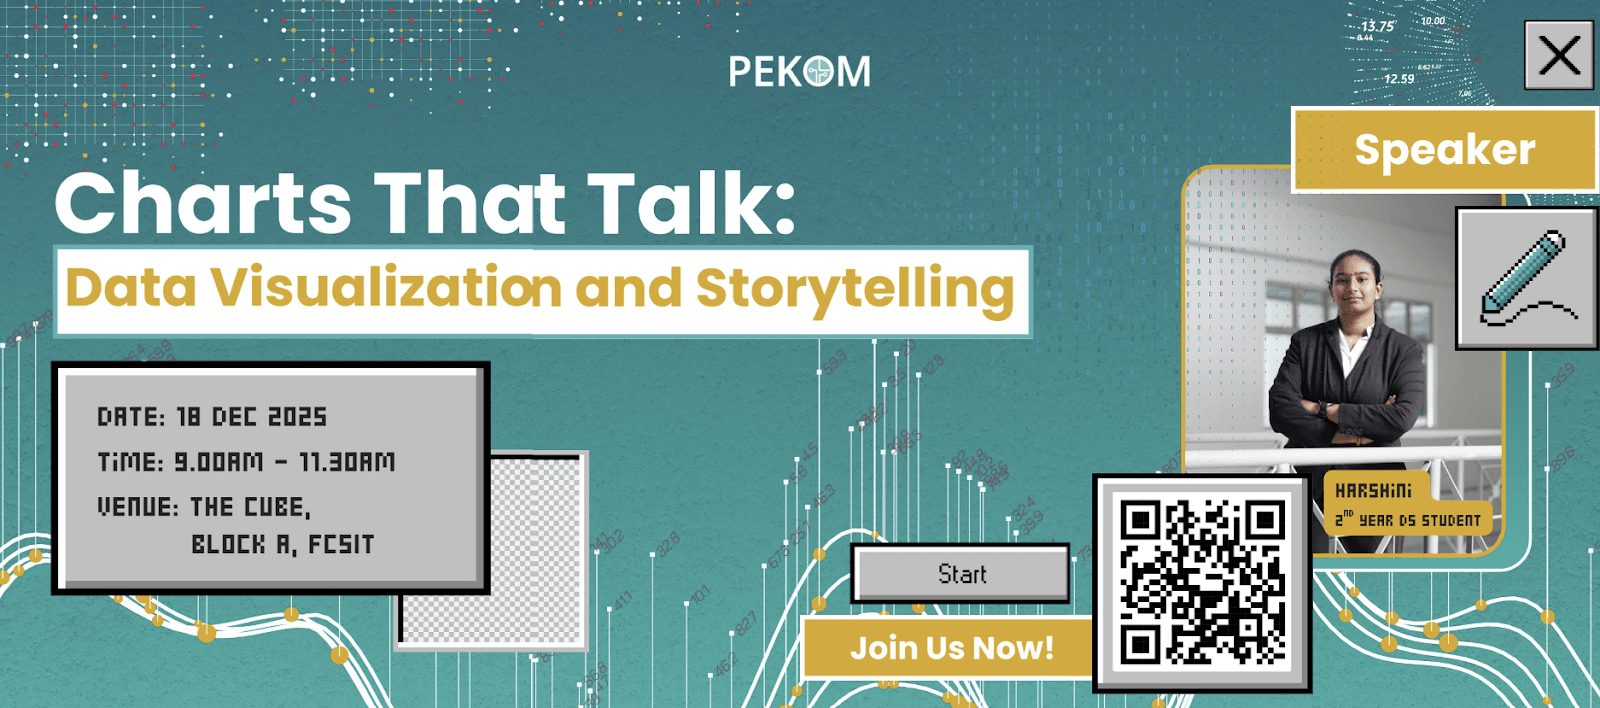
This session brought together students from FCSIT and the Academy of Islamic Studies to explore how good visualization turns raw numbers into insights people can understand and act on.
This workshop walked participants through the data analytics pipeline and the different types of visualizations and when to use each. Participants then got hands-on with Python, using Pandas and Matplotlib for exploratory data analysis, before building an interactive dashboard in Power BI. The session ended with a real-life case study that showed how well-designed charts and a clear narrative can shape decisions.
By the end of the workshop, participants had created their own Matplotlib charts, a Power BI dashboard and a short data story. Attendees gave full marks for the session’s usefulness, flow and committee support, and especially praised the engaging speaker and interactive, hands-on approach. The workshop gave students in Data Science, AI, Information Systems and related fields practical skills they can apply in both their studies and real-world, data-driven decision-making.
0Participants
How it ran
- 9.00 AM
Introduction to Data Visualization and Storytelling
- 9.20 AM
Exploratory Data Analysis: Using Matplotlib and Python for Data Visualization
- 10.15 AM
Visualization and Storytelling: Using the Charts in your Story
- 11.00 AM
Case Study: Real-Life Examples of Visualization and Storytelling
With thanks to
- Harshini A/P Kumara VellSpeaker
Photos
Drag a photo off the pile to see the next one, or tap it to play them all.
1 of 4
More like this

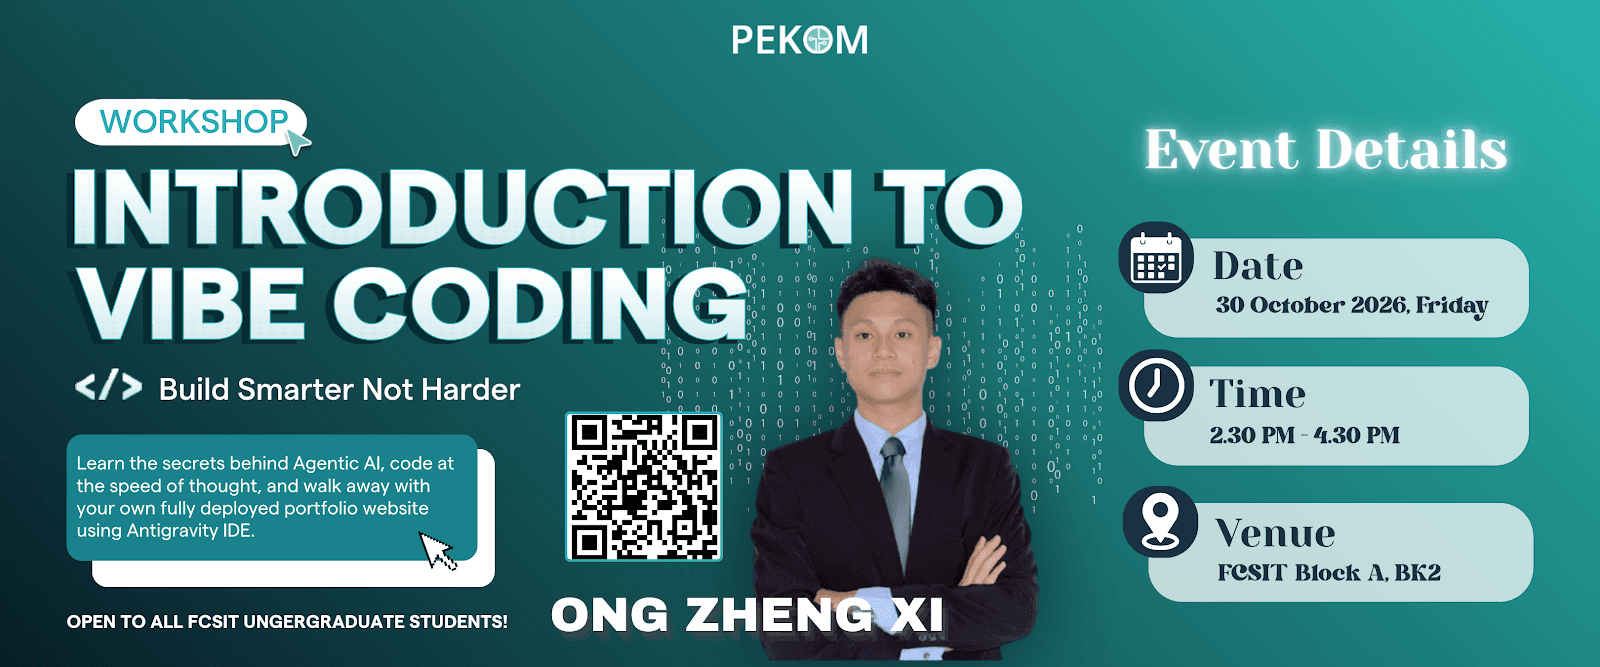
30 Oct 2026Workshop
Build Smarter Not Harder: Introduction to Vibe Coding
Agentic AI & Hands-On Portfolio Workshop